关联应用
关联应用

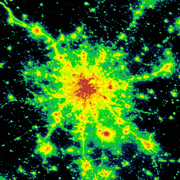
Light Pollution Map
Sky brightness, VIIRS and SQM
开发者: Jurij Stare

239天7小时
最新版本上线距今
1
近1年版本更新次数
2020-09-20
全球最早版本上线日期
版本: 1.1.25
版本更新日期
2025-06-12

Light Pollution Map
Sky brightness, VIIRS and SQM
更新日志
- VIIRS overlays now use Black marble v2.0 instead v1.3 data
- Added VIIRS 2024
- Basemaps and search providers changed because Bing Maps for Enterprise will be discontinued on June 30th 2025应用描述
The map displays VIIRS/World Atlas/Clouds/Aurora/IAU observatories and the user SQM measurements.
The primary use is to show VIIRS/DMSP data in a friendly manner, but over time it also included some other interesting overlays that concern light pollution like SQM/SQC, World Atlas 2015 zenith brightness, clouds, aurora and IAU observatories. If you have a permanent SQM reader installed you can add it to the map by sending me an e-mail.
If you want an analysis of radiance (VIIRS/DMSP) changes over a period of time, then please use the Lighttrends application (look under Help).
Please send comments and requests for new features via email (look under help)
Functionalities:
- VIIRS, Sky Brightness (World Atlas 2015), Cloud coverage and Aurora forecast layers
- VIIRS and Sky Brightness layers can be displayed in color blind friendly colors
- Road & Satellite base maps
- Cloud animation for the last 12 hours
- Get detail radiance and SQM values from layers at a click. For World Atlas 2015, you also get Bortle class estimation.
- SQM, SQM-L, SQC, SQM-LE, SQM readings submitted by users
- Submit your own SQM (L) readings
- Observatories layer
- Save your favorite locations
- Distance measurement tool with azimuth angle report
- Offline mode (Sky brightness map and a base map are saved to your device, so it will be displayed when you are offline)版本: 1.1.22
版本更新日期
2024-07-21
Light Pollution Map
Sky brightness, VIIRS and SQM
更新日志
- Added 2023 VIIRS overlay
- Other minor fixes应用描述
暂无应用描述数据
版本: 1.1.21
版本更新日期
2023-08-18
Light Pollution Map
Sky brightness, VIIRS and SQM
更新日志
- VIIRS chart now has an option to display monthly values
- Fixed trailing artefact produced by the popup window on some devices
- Fixed the issue of previously downloaded offline maps not showing after app update
- Fixed the issue of search bar not showing when there are too many users on the server
应用描述
暂无应用描述数据
版本: 1.1.18
版本更新日期
2023-05-29

Light Pollution Map
Sky brightness, VIIRS and SQM
更新日志
- VIIRS 2022 added
- Search for places now first searches through Geonames database and if it fails it will search Bing's database
- Other minor fixes应用描述
The map displays VIIRS/World Atlas/Clouds/Aurora/IAU observatories and the user SQM measurements overlay over Microsoft Bing base layers (road and hybrid Bing maps).
The primary use is to show VIIRS/DMSP data in a friendly manner, but over time it also included some other interesting overlays that concern light pollution like SQM/SQC, World Atlas 2015 zenith brightness, clouds, aurora and IAU observatories. If you have a permanent SQM reader installed you can add it to the map by sending me an e-mail.
If you want an analysis of radiance (VIIRS/DMSP) changes over a period of time, then please use the Lighttrends application (look under Help).
Please send comments and requests for new features via email (look under help)
Functionalities:
- VIIRS, Sky Brightness (World Atlas 2015), Cloud coverage and Aurora forecast layers
- VIIRS and Sky Brightness layers can be displayed in color blind friendly colors
- Road & Satellite base maps
- Cloud animation for the last 12 hours
- Get detail radiance and SQM values from layers at a click. For World Atlas 2015, you also get Bortle class estimation.
- SQM, SQM-L, SQC, SQM-LE, SQM readings submitted by users
- Submit your own SQM (L) readings
- Observatories layer
- Save your favorite locations
- Distance measurement tool with azimuth angle report
- Offline mode (Sky brightness map and a base map are saved to your device, so it will be displayed when you are offline)版本: 1.1.17
版本更新日期
2022-08-11

Light Pollution Map
Sky brightness, VIIRS and SQM
更新日志
- Added exponential trend (annual % change) to VIIRS radiance chart
- Fixed the issue of non working offline mode in the last version (re-download the cache if not working)应用描述
The map displays VIIRS/World Atlas/Clouds/Aurora/IAU observatories and the user SQM measurements overlay over Microsoft Bing base layers (road and hybrid Bing maps).
The primary use is to show VIIRS/DMSP data in a friendly manner, but over time it also included some other interesting overlays that concern light pollution like SQM/SQC, World Atlas 2015 zenith brightness, clouds, aurora and IAU observatories. If you have a permanent SQM reader installed you can add it to the map by sending me an e-mail.
If you want an analysis of radiance (VIIRS/DMSP) changes over a period of time, then please use the Lighttrends application (look under Help).
Please send comments and requests for new features via email (look under help)
Functionalities:
- VIIRS, Sky Brightness (World Atlas 2015), Cloud coverage and Aurora forecast layers
- VIIRS and Sky Brightness layers can be displayed in color blind friendly colors
- Road & Satellite base maps
- Cloud animation for the last 12 hours
- Get detail radiance and SQM values from layers at a click. For World Atlas 2015, you also get Bortle class estimation.
- SQM, SQM-L, SQC, SQM-LE, SQM readings submitted by users
- Submit your own SQM (L) readings
- Observatories layer
- Save your favorite locations
- Distance measurement tool with azimuth angle report
- Offline mode (Sky brightness map and a base map are saved to your device, so it will be displayed when you are offline)版本: 1.1.16
版本更新日期
2022-04-15

Light Pollution Map
Sky brightness, VIIRS and SQM
更新日志
- VIIRS data source is now NASA instead of NOAA
- Fixed the issue with adding a marker to "My locations"应用描述
The map displays VIIRS/World Atlas/Clouds/Aurora/IAU observatories and the user SQM measurements overlay over Microsoft Bing base layers (road and hybrid Bing maps).
The primary use is to show VIIRS/DMSP data in a friendly manner, but over time it also included some other interesting overlays that concern light pollution like SQM/SQC, World Atlas 2015 zenith brightness, clouds, aurora and IAU observatories. If you have a permanent SQM reader installed you can add it to the map by sending me an e-mail.
If you want an analysis of radiance (VIIRS/DMSP) changes over a period of time, then please use the Lighttrends application (look under Help).
Please send comments and requests for new features via email (look under help)
Functionalities:
- VIIRS, Sky Brightness (World Atlas 2015), Cloud coverage and Aurora forecast layers
- VIIRS and Sky Brightness layers can be displayed in color blind friendly colors
- Road & Satellite base maps
- Cloud animation for the last 12 hours
- Get detail radiance and SQM values from layers at a click. For World Atlas 2015, you also get Bortle class estimation.
- SQM, SQM-L, SQC, SQM-LE, SQM readings submitted by users
- Submit your own SQM (L) readings
- Observatories layer
- Save your favorite locations
- Distance measurement tool with azimuth angle report
- Offline mode (Sky brightness map and a base map are saved to your device, so it will be displayed when you are offline)版本: 1.1.14
版本更新日期
2022-02-12

Light Pollution Map
Sky brightness, VIIRS and SQM
更新日志
- Fixed elevation units when imperial units are selected in settings应用描述
The map displays VIIRS/World Atlas/Clouds/Aurora/IAU observatories and the user SQM measurements overlay over Microsoft Bing base layers (road and hybrid Bing maps).
The primary use is to show VIIRS/DMSP data in a friendly manner, but over time it also included some other interesting overlays that concern light pollution like SQM/SQC, World Atlas 2015 zenith brightness, clouds, aurora and IAU observatories. If you have a permanent SQM reader installed you can add it to the map by sending me an e-mail.
If you want an analysis of radiance (VIIRS/DMSP) changes over a period of time, then please use the Lighttrends application (look under Help).
Please send comments and requests for new features via email (look under help)
Functionalities:
- VIIRS, Sky Brightness (World Atlas 2015), Cloud coverage and Aurora forecast layers
- VIIRS and Sky Brightness layers can be displayed in color blind friendly colors
- Road & Satellite base maps
- Cloud animation for the last 12 hours
- Get detail radiance and SQM values from layers at a click. For World Atlas 2015, you also get Bortle class estimation.
- SQM, SQM-L, SQC, SQM-LE, SQM readings submitted by users
- Submit your own SQM (L) readings
- Observatories layer
- Save your favorite locations
- Distance measurement tool with azimuth angle report
- Offline mode (Sky brightness map and a base map are saved to your device, so it will be displayed when you are offline)版本: 1.1.13
版本更新日期
2021-10-24
Light Pollution Map
Sky brightness, VIIRS and SQM
更新日志
- VIIRS 2021 overlay added应用描述
暂无应用描述数据
版本: 1.1.10
版本更新日期
2021-05-10

Light Pollution Map
Sky brightness, VIIRS and SQM
更新日志
- New option under settings to display VIIRS/World Atlas overlays in a color blind friendly style
- Enabled landscape mode for iPad
- Fixed a bug from previous release where basemap was not displayed in offline mode
- Other应用描述
The map displays VIIRS/World Atlas/Clouds/Aurora/IAU observatories and the user SQM measurements overlay over Microsoft Bing base layers (road and hybrid Bing maps).
The primary use is to show VIIRS/DMSP data in a friendly manner, but over time it also included some other interesting overlays that concern light pollution like SQM/SQC, World Atlas 2015 zenith brightness, clouds, aurora and IAU observatories. If you have a permanent SQM reader installed you can add it to the map by sending me an e-mail.
If you want an analysis of radiance (VIIRS/DMSP) changes over a period of time, then please use the Lighttrends application (look under Help).
Please send comments and requests for new features via email (look under help)
Functionalities:
- VIIRS, Sky Brightness (World Atlas 2015), Cloud coverage and Aurora forecast layers
- VIIRS and Sky Brightness layers can be displayed in color blind friendly colors
- Road & Satellite base maps
- Cloud animation for the last 12 hours
- Get detail radiance and SQM values from layers at a click. For World Atlas 2015, you also get Bortle class estimation.
- SQM, SQM-L, SQC, SQM-LE, SQM readings submitted by users
- Submit your own SQM (L) readings
- Observatories layer
- Save your favorite locations
- Distance measurement tool with azimuth angle report
- Offline mode (Sky brightness map and a base map are saved to your device, so it will be displayed when you are offline)版本: 1.1.9
版本更新日期
2021-01-20
Light Pollution Map
Sky brightness, VIIRS and SQM
更新日志
- New VIIRS overlay (2020)
- Search is now using Geonames database instead of Microsoft service应用描述
The map displays VIIRS/DMSP/World Atlas/Clouds/Aurora/IAU observatories and the user SQM measurements overlay over Microsoft Bing base layers (road and hybrid Bing maps).
The primary use is to show VIIRS/DMSP data in a friendly manner, but over time it also included some other interesting overlays that concern light pollution like SQM/SQC, World Atlas 2015 zenith brightness, clouds, aurora and IAU observatories. If you have a permanent SQM reader installed you can add it to the map by sending me an e-mail.
If you want an analysis of radiance (VIIRS/DMSP) changes over a period of time, then please use the Lighttrends application (look under Help).
Please send comments and requests for new features via email (look under help)
Functionalities:
- VIIRS, Sky Brightness (World Atlas 2015), Cloud coverage and Aurora forecast layers
- Road & Satellite base maps
- Cloud animation for the last 12 hours
- Get detail radiance and SQM values from layers at a click. For World Atlas 2015, you also get Bortle class estimation.
- SQM, SQM-L, SQC, SQM-LE, SQM readings submitted by users
- Submit your own SQM (L) readings
- Observatories layer
- Save your favorite locations
- Distance measurement tool with azimuth angle report
- Offline mode (Sky brightness map and a base map are saved to your device, so it will be displayed when you are offline)


微信公众号

七麦数据公众号

七麦研究院公众号
APP下载
- IOS
- Android

@2014-2022 qimai.cn,北京七麦科技股份有限公司 All Rights Reserved. 京ICP备14049953号
 京公网安备 11010502041000号